5. Graph your heart beat
In this tutorial we shall go through the steps of writing a very crude heart beat sensor. You will need some sensing hardware, either the one from pulsesensor.com or you can roll your own, if you are a hardware wiz.
The final app will render the input signal from the sensor as a graph on Mono’s display. The heart beat will appear as spikes on the graph.
In this video example our hardware engineer Lasse has build his own version of the sensor and software, based on the schematics from pulsesensor.com
We will focus on the software and assume your have the sensor from pulsesensor.com. We will be sampling the ADC at fixed intervals and update the display. Further, if you wish to detect the frequency of the spikes, I will link to a nice article about the topic.
For starters, let us talk about the hardware setup.
Wiring
Regardless of using pulsesensor.com or your own custom, there are a minimum of 3 connections needed:
| Signal | Color | 3.5mm Jack | Mono Pin |
|---|---|---|---|
| Power (+) | Red | Tip | J_TIP |
| Gnd (-) | Black | Sleeve (Base) | |
| Analog ouput | Purple | Ring 1 (Outer most) | J_RING1 |
The colors are in respect to pulsesensor.com’s pin connections
The analog output is the sensors signal that we need to feed to the Mono’s ADC. The 5V power source we can get from the USB connection. As long as we keep the USB connected, we do not need to use Mono’s internal boost converter.
Step 1: Jack connector
You need to have a 3 or 4 pole 3.5mm jack connector. If you have one in your stash, use that. If not, you need to go acquire one from the web or your favourite electronics dealer.
Then, solder the 3 wires from the pulse sensor to the connector, as layed out in the table above. (If you use a 4 pole jack, leave Ring 2 unconnected.)
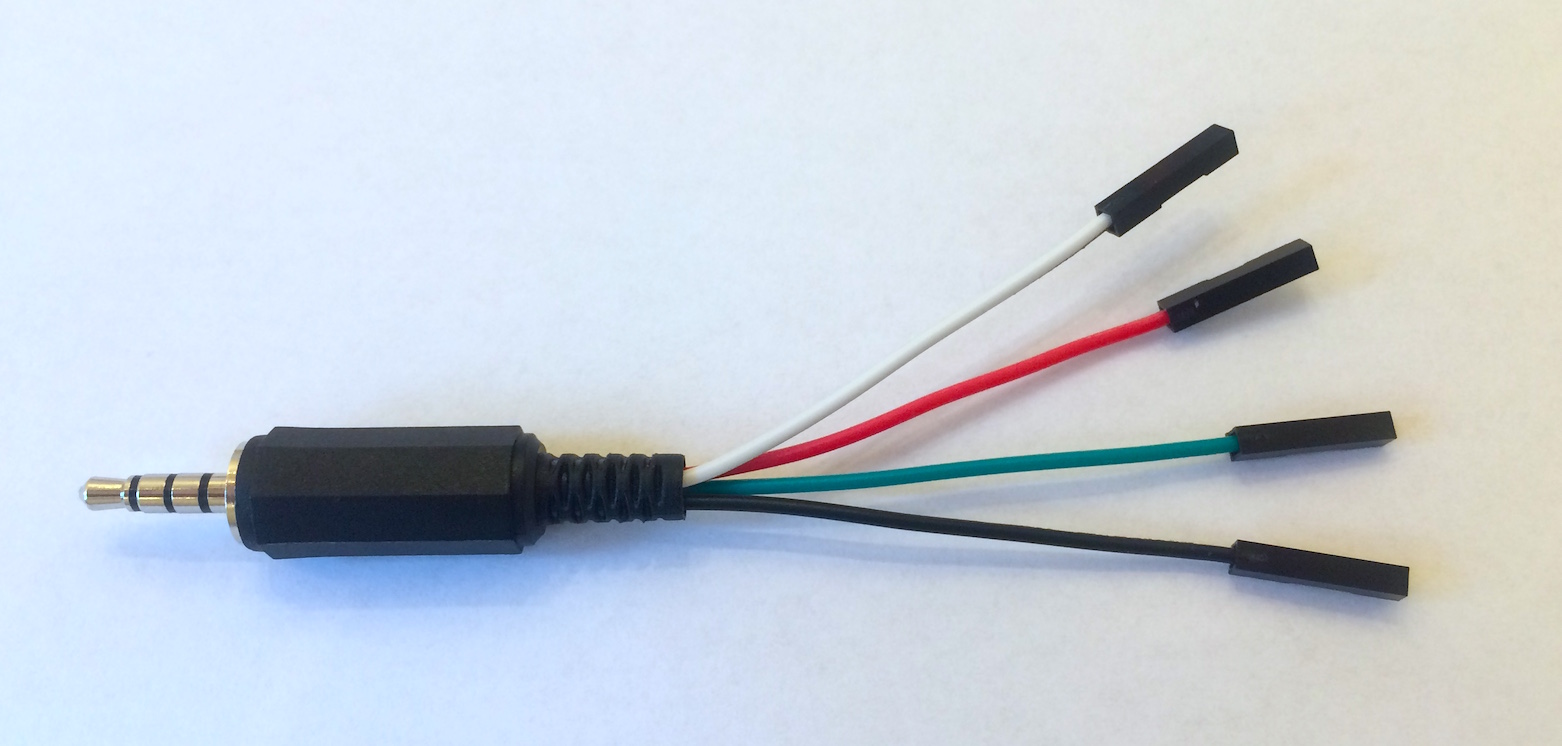
For ease I have created a jack connector like this, that is essentially a breakout board for a 3.5mm jack connector. You can do the same, if you do not wish to solder directly on your pulsesensor.
Software
When the hardware in place, we are ready to code! We need to do a few steps in software to achieve our goal:
- Enable voltage supply output in the jack tip pin
- Sample the ADC at fixed intervals
- Lowpass filter the ADC output
- Draw a graph of the filtered signal.
Step 2: New project
Note
I have taken the liberty to assume that you already have installed Mono SDK. If you have not, please follow the getting started tutorial, and return here again thereafter.
First, we must create a new mono application project. Fire up a terminal (or Command prompt on Windows) and:
$ monomake project --bare pulsesensor
Creating new bare mono project: pulsesensor...
 * pulsesensor/app_controller.h
 * pulsesensor/app_controller.cpp
Writing Makefile: pulsesensor/Makefile...
Atom Project Settings: Writing Auto complete includes...
Notice the --bare option. This creates an empty project without example code. Step into the newly created directory:
$ cd pulsesensor
Now, you should spin up your favorite editor or IDE. Since the monomake tool automatically adds a code completion settings file for Atom’s autocomplete-clang plugin, I will use Atom in the tutorial:
$ atom .
This command opens the project in Atom.
Step 3: Drawing a Graph
Now that we have en empty project, we need a C++ class to draw the graph on the display. In Mono, all software classes that draw to the screen must inherit from the View class: mono::ui::View.
Create a new file called graph.h. This file should implement our GraphView class, that will draw the graph on the display. Then, paste this into the file:
#include <mono.h>

class GraphView : public mono::ui::View
{
public:

    int values[176];
    int dataCursor;
    int dispCursor;

    GraphView(uint16_t yOffset, uint16_t height) :
        View(mono::geo::Rect(0,yOffset,176,height))
    {
        dispCursor = 0;
        dataCursor = 0;
    }

    void append(int value)
    {
         static const int maxX = 0x8000;
         static const int minX = 0x4000;

        if (value < minX)
            value = minX;
        else if (value > maxX+minX)
            value = maxX+minX;

        int scaled = (value * viewRect.Height() / maxX);
        int graphOffset = minX * viewRect.Height() / maxX;
        values[dataCursor++] = scaled - graphOffset;

        if (dataCursor >= 176)
            dataCursor = 0;
    }

    void repaint()
    {
        painter.setForegroundColor(mono::display::RedColor);
        painter.setBackgroundColor(StandardBackgroundColor);

        if (dispCursor < dataCursor)
        {
            drawDiff(dispCursor, dataCursor);
            dispCursor = dataCursor;
        }
        else
        {
            drawDiff(dispCursor, viewRect.Width());
            dispCursor = 0;
        }

        painter.setForegroundColor(mono::display::GreenColor);
        painter.drawVLine(dispCursor, viewRect.Y(), viewRect.Y2());
    }

    void drawDiff(int begin, int end)
    {
        for(int x = begin; x<end; x += 2)
        {
            painter.drawFillRect(x, viewRect.Y(), 2, viewRect.Height(), true);
            painter.drawFillRect(x, viewRect.Y()+values[x], 2, 2);
        }
    }

};
Let us go through the code, step by step.
Declaration
class GraphView : public mono::ui::View
{
public:

    int values[176];
    int dataCursor;
    int dispCursor;
First we declare the class GraphView and define it inherits from View. We define 3 member variables, an array of sample values and cursors that points to the lastest sample. Both the latest added sample to the values array, and the lastest values painted on the display.
Constructor
GraphView(uint16_t yOffset, uint16_t height) :
    View(mono::geo::Rect(0,yOffset,176,height))
{
    dispCursor = 0;
    dataCursor = 0;
}
The class’ constructor takes 2 arguments, an Y offset and a height. The graph will always take up the full width of the screen, which is 176 pixels. The Y offset defines where the view is positioned with repect to top of the screen.
The body of the constructor sets the 2 cursor variables to zero. This is important in an embedded environment, since you cannot know the initial value of a variable.
Append method
This method adds a new value to the graph and increments the cursor. First the new value is cropped to the max and min boundaries defined by the static variables.
void append(int value)
{
     static const int maxX = 0x8000;
     static const int minX = 0x4000;

    if (value < minX)
        value = minX;
    else if (value > maxX+minX)
        value = maxX+minX;
Next, we scale the value to fit the height of the graph view itself. Before adding the new value to the sample array, we substract a static offset.
int scaled = (value * viewRect.Height() / maxX);
int graphOffset = minX * viewRect.Height() / maxX;
Attention
In Mono’s display coordinate system the Y axis is flipped. This means positive Y direction is downward.
The static offset (graphOffset) ensures that that center of the graph is the center of the value boundaries. The input span is trimmed from 0 to 0xFFFF, to 0x4000 to 0x8000.
Hint
I have chosen these numbers to ease the CPU’s integer division. When dividing by exponents of 2, the compiler can substitute the division with a shift operation.
The scaled value is saved in the values array, and the dataCursor is incremented. If the cursor exeeds the width of the array, it is reset to 0.
Repaint
The repaint() method is part of the View interface, and is automatically called by the display system. Inside this method we implement the actual drawing of the graph.
All Views share a painter object that can draw shapes on the screen. First, we set the painters color palette, a foreground and a background.
void repaint()
{
    painter.setForegroundColor(mono::display::RedColor);
    painter.setBackgroundColor(StandardBackgroundColor);
Next, if the data cursor is larger than the display cursor, we call the drawDiff method for the difference. Then the dispCursor is set equal to the data cursor.
if (dispCursor < dataCursor)
{
    drawDiff(dispCursor, dataCursor);
    dispCursor = dataCursor;
}
The else branch of the if statement is taken when the dataCursor has looped or reset. In this case we draw the data from display cursor position up to the end of the array.
else
{
    drawDiff(dispCursor, viewRect.Width());
    dispCursor = 0;
}
The last task is to draw a green sweeping cursor, that indicate the end of the buffer. We set the foreground color palette to green, and draw a vertical line at the position of the display cursor.
painter.setForegroundColor(mono::display::GreenColor);
painter.drawVLine(dispCursor, viewRect.Y(), viewRect.Y2());
drawDiff
This is where the graph drawing occurs. The method receives two parameters: the begining and the end of the array values to draw.
We loop through the values and at each value we paint a 2 pixel wide vertical line, using the background color. Then, we draw a filled 2x2 pixels rectangle, at the x value position.
for(int x = begin; x<end; x += 2)
{
    painter.drawFillRect(x, viewRect.Y(), 2, viewRect.Height(), true);
    painter.drawFillRect(x, viewRect.Y()+values[x], 2, 2);
}
This is the complete graph class, that can draw an array of values as a graph on the screen.
Note
You might wonder where the .cpp implementation file for this class is. You can in fact implement function bodies in header files. However, this is far from the best practice. My only excuse to do it here, is that I am lazy and I try to keep this tutorial as short as possible.
Step 4: App Controller
Now we will turn attention to the app_controller.h and .cpp files. This object will control power and ADC sampling, lowpass filter and utilize our graph view.
Right now the class is just a stub of empty methods. Start by going to the app_controller.h and we will add some member variables. Edit (or copy-paste) this into your copy, to make it look like this:
#ifndef app_controller_h
#define app_controller_h

#include <mono.h>
#include <mbed.h>
#include "graph.h"

class AppController : public mono::IApplication {
public:

    mbed::AnalogIn adc;         // Analog input
    mbed::Ticker adcTicker;     // interrupt based timer
    GraphView graph;            // Our graph view

    uint16_t filter[8];         // Low pass filter memory
    int filterPos;              // Filters oldest sample pointer

    AppController();            // default constructor

    void sampleAdc();           // sample ADC & update display

    void monoWakeFromReset();
    void monoWillGotoSleep();
    void monoWakeFromSleep();
};

#endif /* app_controller_h */
Basically we have added member variables to handle the analog pin input, a timer (called a Ticker in mbed) to sample at regular intervals and a moving average lowpass filter.
We also added the method sampleAdc() that should be called by the Ticker when the analog input must be sampled.
AppController implementation
Now, go to the app_controller.cpp file and overwrite its contents with this:
#include "app_controller.h"

AppController::AppController() :
    adc(J_RING2),
    graph(50, 220-50)
{
    adcTicker.attach_us(this, &AppController::sampleAdc, 10000);

    graph.show();

    filterPos = 0;
    memset(filter, 0, 8);
}

void AppController::sampleAdc()
{
    filter[filterPos++] = adc.read_u16();

    if (filterPos >= 8)
        filterPos = 0;

    int sum = 0;
    for (int i=0;i<8;i++)
        sum += filter[i];

    graph.append( sum / 8 );

    graph.scheduleRepaint();
}

void AppController::monoWakeFromReset()
{
    // enable J_TIP power
    mbed::DigitalOut jpi(JPI_nEN, 1);
    mbed::DigitalOut jpo(JPO_nEN, 0);

}

void AppController::monoWillGotoSleep()
{
    mbed::DigitalOut jpi(JPI_nEN, 1);
    mbed::DigitalOut jpo(JPO_nEN, 1);

    adcTicker.detach();
}

void AppController::monoWakeFromSleep()
{
    mbed::DigitalOut jpi(JPI_nEN, 1);
    mbed::DigitalOut jpo(JPO_nEN, 0);

    adcTicker.attach_us(this, &AppController::sampleAdc, 10000);

    graph.scheduleRepaint();
}
Again, I will chop up the code and explain the functions and their job bit by bit.
Constructor
When our AppController class is constructed by the system, it needs to setup two of its member objects: mbed::AnalogIn and our own GraphView. These have designated constructors that we need to call explicitly, and we do that in the contructor right before the actual function body:
AppController::AppController() :
    adc(J_RING1),
    graph(50, 220-50)
{
    ...
Here we define we want the ADC to sample the J_RING1 pin. The GraphView is set to occupy the lower 3/4 of the screen. This is defined by the Y offset of 50 pixels and the height of 170 pixels.
adcTicker.attach_us(this, &AppController::sampleAdc, 10000);

graph.show();

filterPos = 0;
memset(filter, 0, 8);
In the constructor body we first install the callback function for the Ticker. It will call sampleAdc every 10 ms. This gives us a samplerate of 100 Hz.
We tell our graph to be visisble, meaning that the display system will bother to paint it.
Lastly, the running average filter is initialized. We zero all values and set the pointer to 0.
Sampling the input
The sampleAdc method is called by the Ticker from inside the MCU timer interrupt. This means that this method will run inside a interrupt context, requiring it to be fast.
filter[filterPos++] = adc.read_u16();

if (filterPos >= 8)
    filterPos = 0;
The input pin is sampled, and the result is returned as an unsigned 16-bit integer. This sample value is stored in the filter array and the filter position is incremented.
When the position reaches the end of the array, it is reset.
int sum = 0;
for (int i=0;i<8;i++)
    sum += filter[i];

graph.append( sum / 8 );
Before inserting the new value into the graph, we lowpass filter it, by calculating the average value of the entire filter array. This average is then appended to the graph.
Note
This filtering should remove any 50 Hz or 60 Hz noise. If it does not, you might need to tweak it a little bit. (Changing the array length.)
graph.scheduleRepaint();
The final line tells the graph that it must repaint itself, at the next vsync event. Note that we do not repaint the graph view from here, it is only scheduled for repaint at a later oint in time.
Power event methods
The next 3 methods are the standard power event methods, handling reset, sleep and wake routines. Here we need to setup the power and shut it down again upon sleep.
void AppController::monoWakeFromReset()
{
    // enable J_TIP power
    mbed::DigitalOut jpi(JPI_nEN, 1);
    mbed::DigitalOut jpo(JPO_nEN, 0);
}
We use mbed’s I/O interfaces to set the values of the power control switches on Mono. Specifically we set the JPI_nEN and the JPO_nEN pins, to enable power output on the jack connector’s TIP pin. By asserting JPO_nEN we connect the VAUX power line to J_TIP.
Just to make our intension clear, we also de-assert JPI_nEN, to explicitly state that there is no short circuit from VAUX to VBUS. (Refer to the schematics for Mono.)
void AppController::monoWillGotoSleep()
{
    mbed::DigitalOut jpi(JPI_nEN, 1);
    mbed::DigitalOut jpo(JPO_nEN, 1);

    adcTicker.detach();
}
In the go-to-sleep routine we cut the power to J_TIP and disable the Ticker. If we do not disable the ticker, we risk having the timer fire when the RTC system runs in sleep mode.
void AppController::monoWakeFromSleep()
{
    mbed::DigitalOut jpi(JPI_nEN, 1);
    mbed::DigitalOut jpo(JPO_nEN, 0);

    adcTicker.attach_us(this, &AppController::sampleAdc, 10000);

    graph.scheduleRepaint();
}
Upon wake-up we re-enable power output on J_TIP and activate the Ticker again. Because the display has been powered off, we also need to repaint its content.
Step 5: Result
Now, is the moment of truth where you should compile the app. Go to the terminal and run:
$ make
Hopefully it compiles and you should see something like this:
rm -f pulsesensor.elf mono_project.map
rm -f -r build
creating build directory
Compiling C++: app_controller.cpp
Compiling C++: Default main function
Linking pulsesensor.elf
Install the app on your Mono by running:
$ make install
If everything goes as we expect, you should see the signal stabilizing around the middle of the graph view. This is the DC offset removal filter in the pulsesensor that is settling.
Place your finger or earlobe on the sensor, sit still and look for the spikes, after the DC filter has settled again.
This is what you should see on Mono’s display. Depending on the sensor environment, spikes might be more or less visisble.
Further reading
If you wish to add a BPM counter, you need to detect the spikes in software. To do that I will recommend the very detailed articles on pulsesensor.com: